
This article Covers the following topics:
Item Analytics
Individual Item Analytics (Item Stats)
Delivery Analytics
Item Analytics
1- Click on the project you would like to see the Analytics
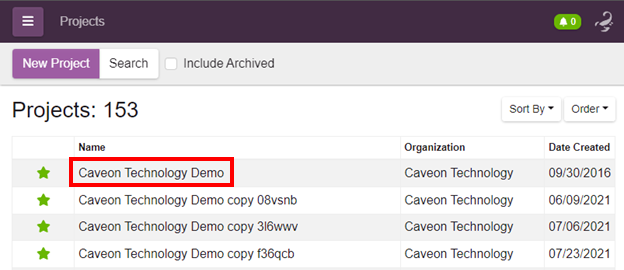
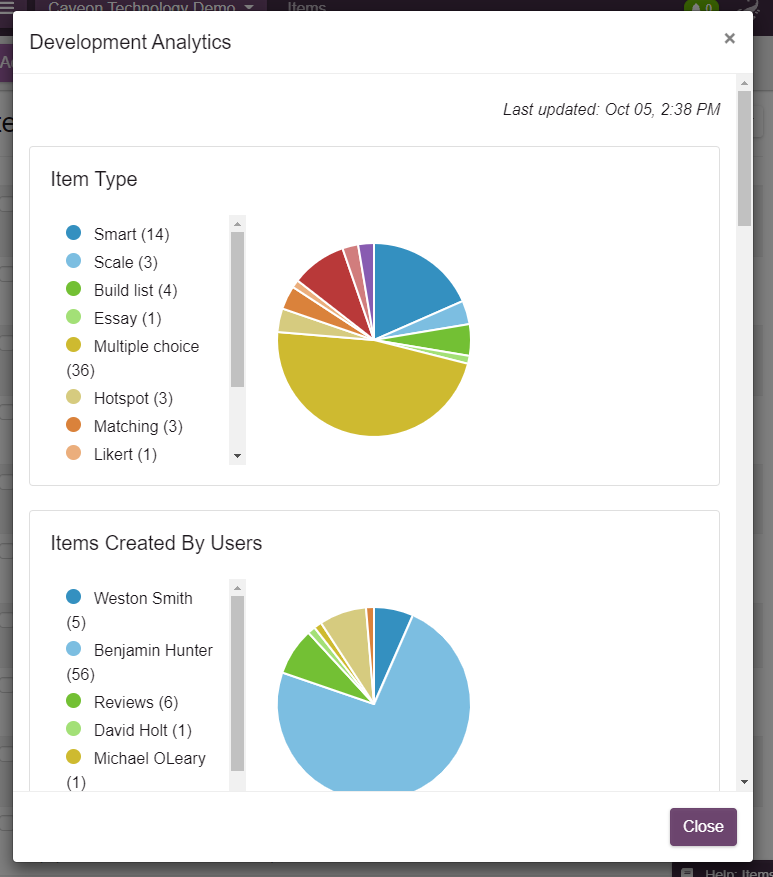
2- Click on the Analytics button.
3- After clicking on the Analytics button, it will display a series of pie charts showing how many of each item type made, how many items each user has created, as well as the data for the custom field made in settings. Make sure you scroll down to see everything presented.
Individual Item Analytics
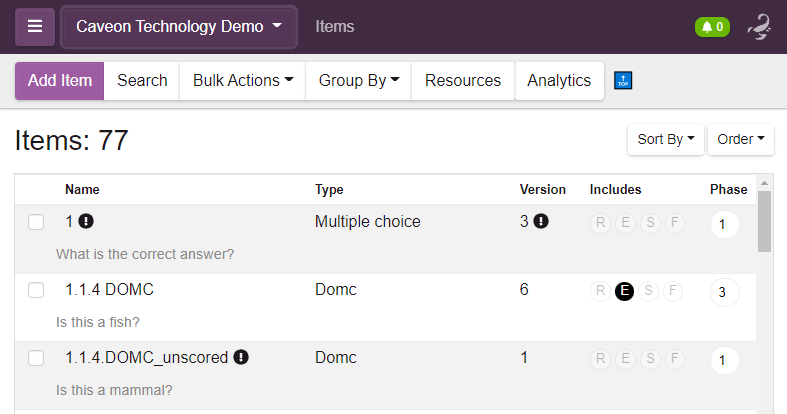
1- Click on the project you would like to see the Analytics
2- Click on the item you want to look at the analytics for.
3- Click on the Items Stats tab above the content section.
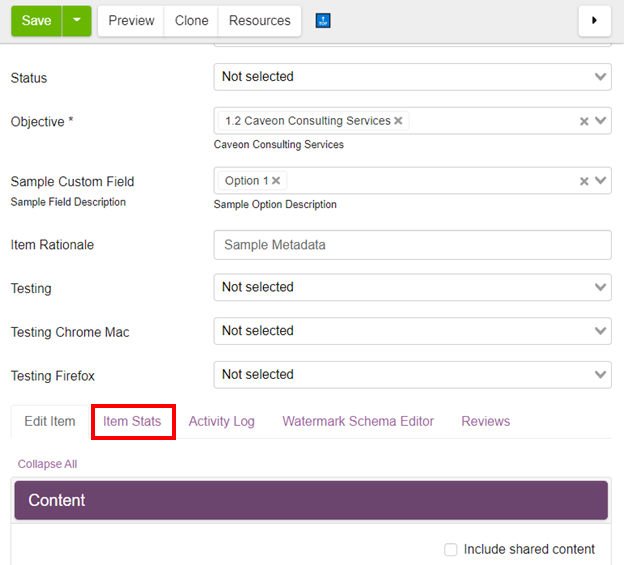
4- Here you will be able to find stats relevant to that item.
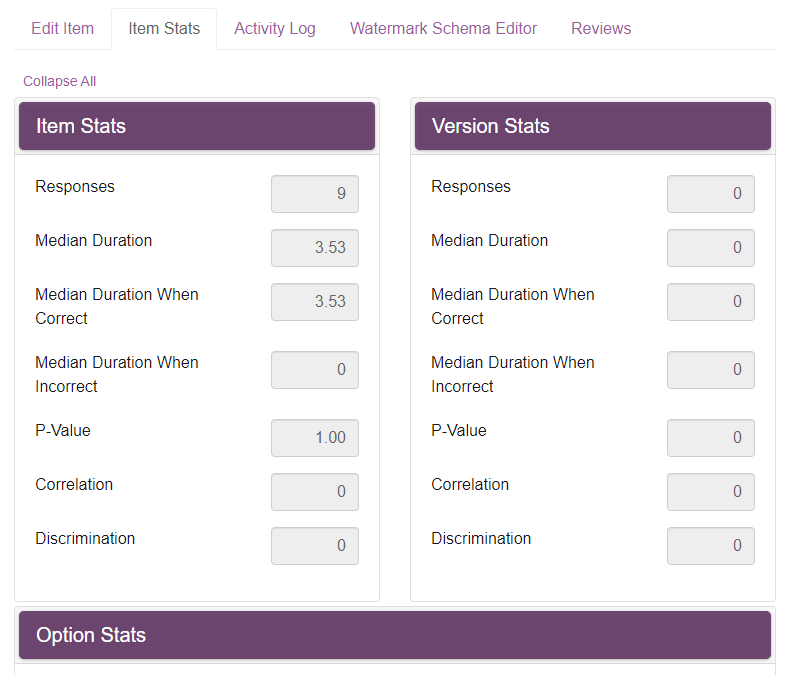
Definitions Used:
P-value: The proportion of examinees that answered an item correctly. P-value ranges from 0 to 1. A high value means that the item is easy, a low value means the item is difficult. For a 4-option multiple choice item, we would expect 25% of the examinees to respond correctly purely by chance.
Correlation: How well the item relates to the other items. This is quantified by correlating the scores on each item with the total scores of the other items.
Discrimination: How well an item separates between high and low ability test takers. Good items should have a high discrimination.
Flagging Item Data:
These recommendations are general guidelines and should not be understood to represent a complete psychometrically sound item analysis.
Flagging and analyzing items for item performance, cut score determination, form building, etc. should be done by or under the guidance of a Psychometrician.
1. Flag items as being too easy when Pvalue is above 0.90
2. Flag items as being too difficult when Pvalue is below 0.45
3. Flag items as having a low correlation rate when below 0.15
4. Flag items with a high pass rate and a low correlation rate
5. Flag items with a low pass rate and a low correlation rate
Sample size needs to be sufficient to support sound item analysis. Typically, an item needs to be exposed to at least 50 test takers to be considered to have representative item statistics.
Delivery Analytics
1- Click on the project you would like to see the Analytics
2- Click on the drop down menu, then click on Deliveries
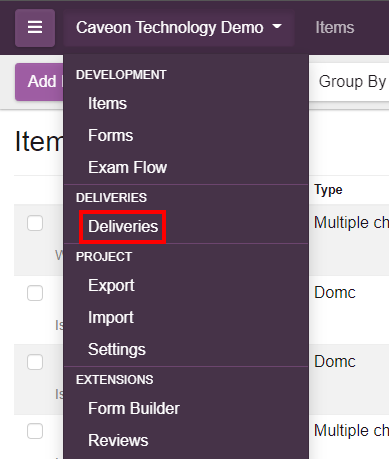
3- Click on the Analytics button.
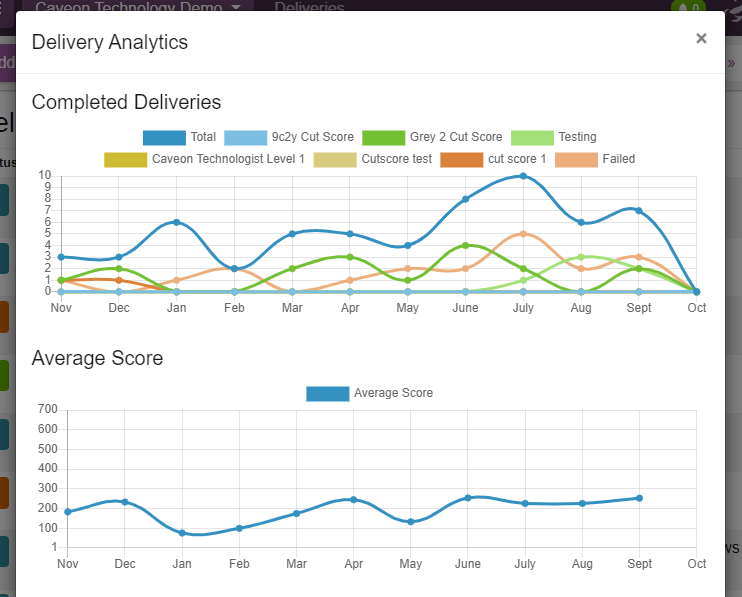
4- After clicking on the Analytics button, it will display a series of line graphs that show you deliveries completed, average score, average duration, and pass rate. Make sure you scroll through to see all of the graphs.
Comments
0 comments
Article is closed for comments.